Real Uptime Monitoring of Oracle APEX Instances

Running a production application on an Oracle APEX instance? Then read on!
Making sure your application is up and running 24/7 doesn't need to be a daunting task, plus it may not even cost you a dime! UptimeRobot provides 50 free monitors that can poll your servers using the smallest interval of 5 minutes. You can easily monitor websites and receive multi-channel notifications of downtime. No excuse!
There are several solutions out there for server monitoring including the ever popular, open-sourced Nagios. However, build-your-own solutions often require more resources to set up. It only makes sense to host the monitoring software on an independent server - possibly even network/infrastructure - that your APEX instance uses. Not forgetting the much needed knowledge and time spent to set up the systems.
UptimeRobot provides monitoring services for free or for fee. You can choose four monitoring types:
1.Ping
Monitors servers by sending ICMP packets and waiting for a response. Sending ping requests are not logged, so that can be a good thing. However, for web servers, a ping response is not a reliable measure of whether the required service is operational. A server can respond to pings even though the server application, e.g. Apache HTTPD server, is not running.
To configure a Ping Monitor:
- Select the monitor type Ping.
- Enter a friendly name.
- Enter the IP address or fully-qualified domain name to monitor, e.g. 111.111.111.111, websvr.contoso.com.
- Set the monitoring interval.
- Select the contact(s) to be notified.
- Click Create Monitor.
2. Port
Port monitoring allows you to monitor services through the ports that they use. For web servers, this is usually HTTP (80) or HTTPS (443), but one could also monitor other services like FTP and mail services.
To configure a Port Monitor:
- Select the monitor type Port.
- Enter a friendly name.
- Enter the IP address or fully-qualified domain name or URL to monitor.
- Select the port to monitor. Choose from:
- HTTP (80)
- HTTPS (443)
- SMTP (25)
- POP3 (110)
- IMAP (143); or
- Custom Port
- Specify a port number if Custom Port was chosen in step (4).
- Set the monitoring interval.
- Select the contact(s) to be notified.
- Click Create Monitor.
3. HTTP(s)
This monitor type uses HTTP status codes returned by the specified URL or IP address to indicate whether the service is up (200) or down (anything else, e.g. 404, 500, 504 etc.).
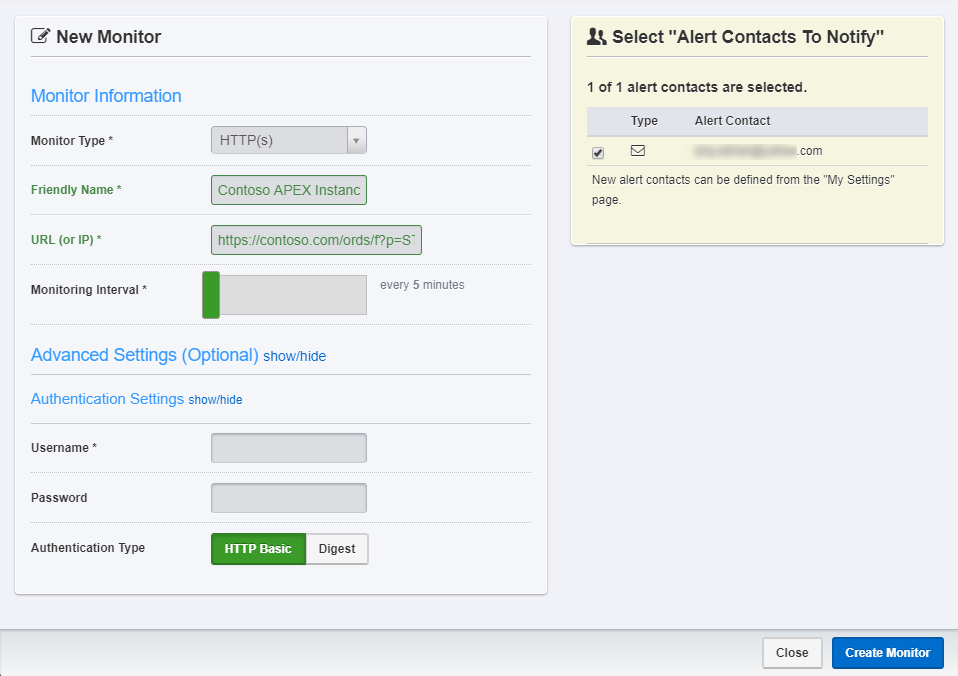
To configure a HTTP(s) Monitor:
- Select the monitor type HTTP(s).
- Enter a friendly name, e.g. Contoso APEX Instance.
- Enter the URL or IP address to monitor, e.g. https://contoso.com/ords/f?p=STORE:HOME:0.
- Set the monitoring interval. For free accounts, the range is from 5 minutes to 24 hours.
- If authentication is required, then click ont he Advanced Settings, Authentication Settings and then enter the user credentials and authentication type.
- Select the contact(s) to be notified.
- Click Create Monitor.
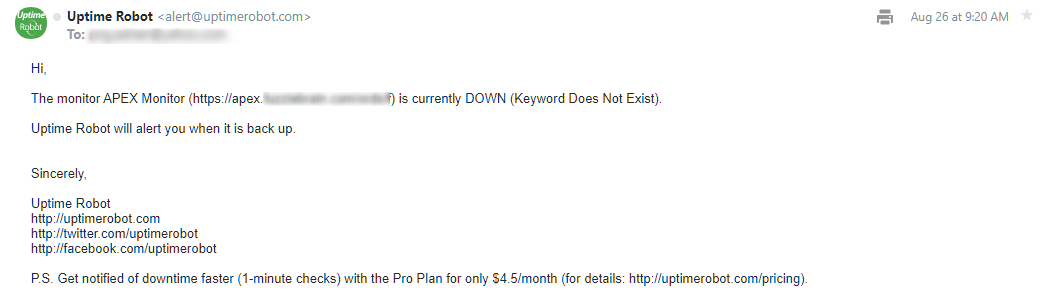
4. Keyword
Keyword monitoring provides the ability for more fine-grain monitoring.
To configure a Keyword Monitor:
- Select the monitor type Keyword.
- Enter a friendly name, e.g. Contoso Homepage.
- Enter the URL or IP address to monitor, e.g. https://contoso.com/ords/f?p=STORE:HOME:0.
- Enter the keyword to scan for, e.g. Welcome to Contoso Store. Note that the keyword entered is case-sensitive.
- Set to alert when either Keyword Exists or Keyword Not Exists
- Enter authentication information if required.
- Select the contact(s) to be notified.
- Click Create Monitor.
NOTEWORTHY Web servers will log access by both HTTP(s) and Keyword monitor types. Keep that in mind when setting up monitors with short intervals.
Notifications
When setting up monitors, you need to specify which contact(s) to notify when things go wrong. This is set up under My Settings. You may add contacts using either of the following technologies:
- Pro SMS (for paid accounts, receive up to 10 messages included in the subscription, otherwise SMS credits are required)
- Webhook
- Email-to-SMS (uses service providers' free email-to-SMS gateways and may not always be stable)
- Boxcar 2
- Pushbullet
- Pushover
- HipChat
- Slack
There is also an option of adding a public status page or using RSS feeds to display server statuses on your website. These are nice to haves, but not always necessary.
Summary
For APEX applications, I would generally prefer using either HTTP(s) or Keyword monitoring as they provide the most reliable method for detecting if the web server (reverse proxy), JavaEE Web Container (hosting ORDS) and/or Oracle Database had gone down. All three are important services responsible for delivering APEX applications. Any of them going down will trigger an alert.
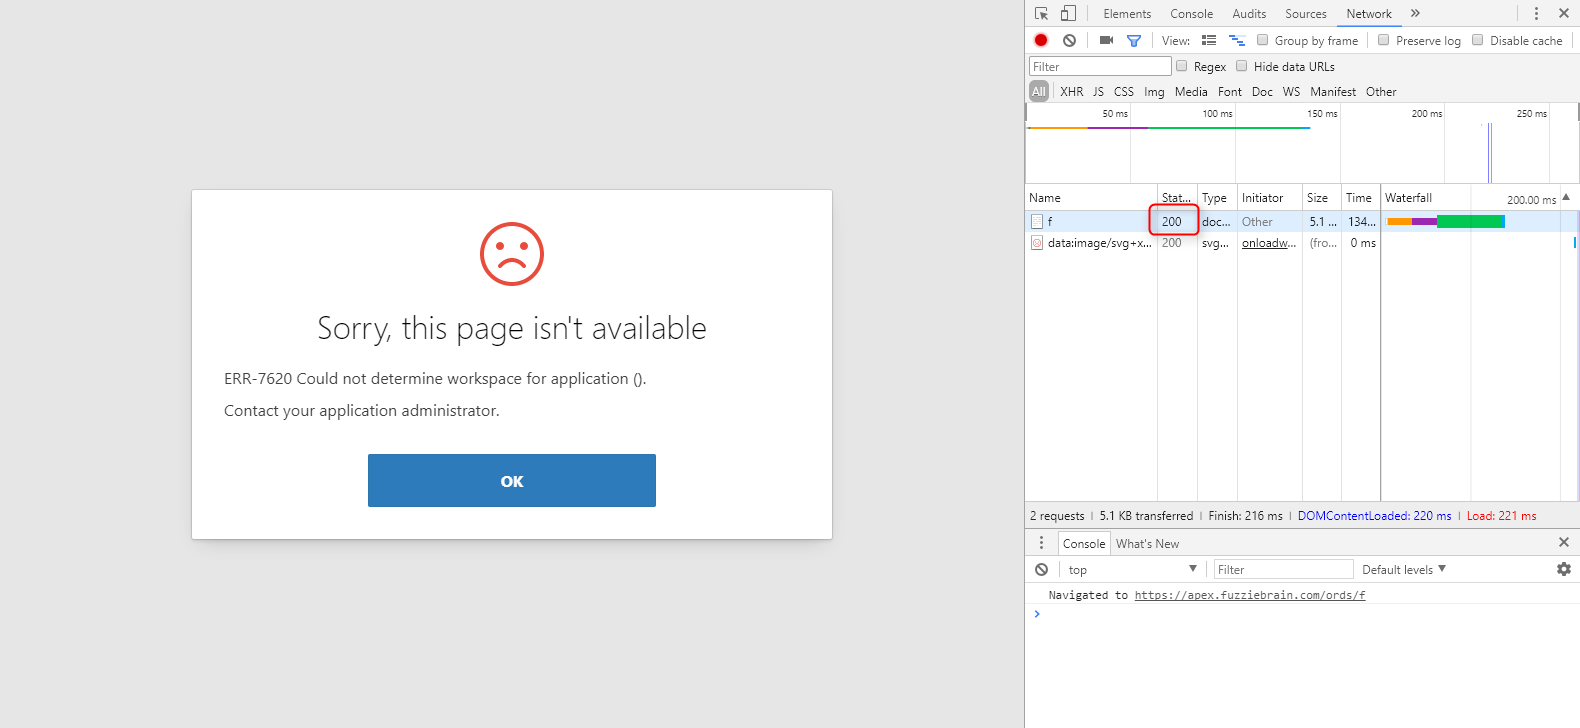
Between the two though, I feel Keyword stands out. It really depends on what your definition of "uptime" is. To me, that includes having the APEX instance deliver the expected outcomes. Any errors as a result of application runtime execution, should also classify as downtime. Often, APEX would still return a HTTP status code 200 even if an error had occured. Either we trap these events during error handling and then return the appropriate status code, or create a strategy involving keywords and then monitor these terms to signal service status for better insights to availability.
That said, regardless of what you choose, anything is better than nothing. So get monitored now!